How
to create a chart in WinCross
Located under
Run | Charts where all chart setup and options are conveniently
in one location (Another way to access the Create Charts dialog box
is to select the pie chart icon on the vertical panel towards the
right side of the screen).
NOTE:
Previous chart (.cht) files are not compatible with version
22).
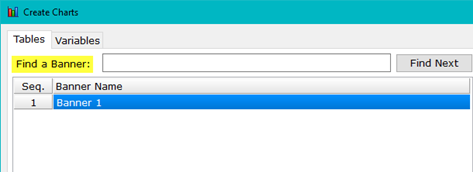
- Banner
- Select a banner to run with your chart.
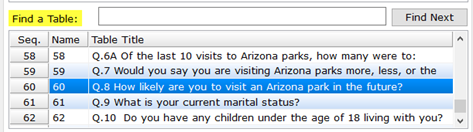
- Table
-
Select which table you would like displayed in the chart.
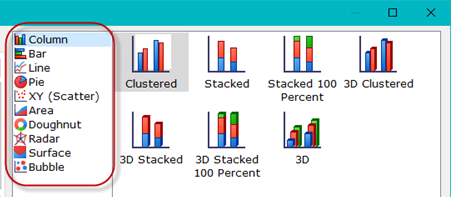
- Choose a Chart
- Column
- Displays vertical bars.
- Bar
- Displays horizontal bars.
- Line - Displays connected line between
points on chart.
- Pie
- Displays percent of whole
for each point.
- XY
(Scatter) - has points that
show the relationship between two sets of data.
- Area - It
is based on the line chart with the area between the axis
and the line colored in.
- Doughnut - Like a pie chart, but with
the ability to add comparing categories.
- Radar - Allows multiple variables
(3 or more) to be displayed on a two-dimmensional chart.
- Surface - Displays a sets
of values in the form of a surface where the points in a data series
for a category are displayed behind one another.
- Tip: Usually used to represent
landforms or the surfaces of objects.
- Bubble - Similar to scatter, the relationship
between variables are depicted by the dimmensions of each
"bubble".
- Show
Labels
- Values
- show values for each point on chart
- Percents
- show percents for each point on chart (Only available for
some chart options).
- Labels
- show labels for each point on chart
- Show base on labels
- Column base (N)
is added for each category. When selected users can provide
custom text that will appear before the base (N).
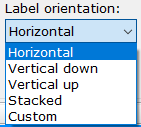
- Label
Orientation - Choose
how to display labels
- Horizontal
- Vertical
down
- Vartical
up
- Stacked
- Custom
- Label
Loction - Options depend
on which chart style is selected
- Column,
Bar
- Center
- Inside
end
- Inside
base
- Outside
end
- Pie
- Center
- Inside
end
- Outside
end
- Best
fit
- Line,
XY (scatter), Bubble
- Center
- Left
- Right
- Above
- Below
- Note: Area, Doughnut, Radar and Sruface
charts don't have Label Location options
- Data
to use of charts
- Frequencies
- display frequencies for chart values
- Vertical percents
- display Vertical percents for chart values
- Horizontal percents -
displayHorizontal percents for chart values
- Constant percents -
displayConstant percents for chart values
- Row/Column means -
displayRow/Column means for chart values
- Data
to use of charts
- Use
row data as X axis
- Use
column data as X axis
- Add
Chart -
Must select a banner and a table to add a chart in the Tables
tab or select any variable in the Variables tab
- Variable:
Variable Options only apply to charts that reference a variable
and not banner x table combination. Variables are converted
to charts without the need to first create a table.
- Delete
Chart -
You can delete several charts at the same time by holding down
the Shift key when charts are listed contiguously. If listed charts
are noncontiguous, you are still able to select multiple charts
by holding down the Ctrl key.
- Duplicate
Chart
- Allows you to duplicate charts and make any changes separately.
- Banner
Options
- Allows you to choose which banner points will be displayed for
selected charts.
- Table
Options
- Allows you to choose which answer options will be displayed
for selected charts.
- Chart
options
- Allows you to customize the chart (e.g., Tables,
Chart
Area, Threshold,
Axes,
Legend,
Series
Colors, Branding,
Significance).
- Preview
Selected
- Allows
you to preview selected charts in either a PowerPoint, Word or
Excel format. If you do not want a particular chart displayed,
uncheck the box associated with that chart.
- Apply
Changes -
Any changes made that affect the output of the chart must be applied
before running.
Related topics:
Chart | Banner
& Table Options
Chart | Banner
Options
Chart | Output
| Files
Chart | Table
Options
Chart Options
Chart Options
| Axes
Chart Options
| Branding
Chart Options
| Chart Area
Chart Options
| Legend
Chart
Options | Series Colors
Chart Options
| Series Colors | Add Multiple Colors
Chart Options
| Series Colors | Color Templates
Chart
Options | Significance
Chart
Options | Significance | Significance Indicator
Chart Options
| Tables
Chart Options
| Threshold
Chart Variable
| Options