Presentation
| Crosstab
Use
the Crosstab feature to easily
add banners and tables to your presentation that can then be further customized.
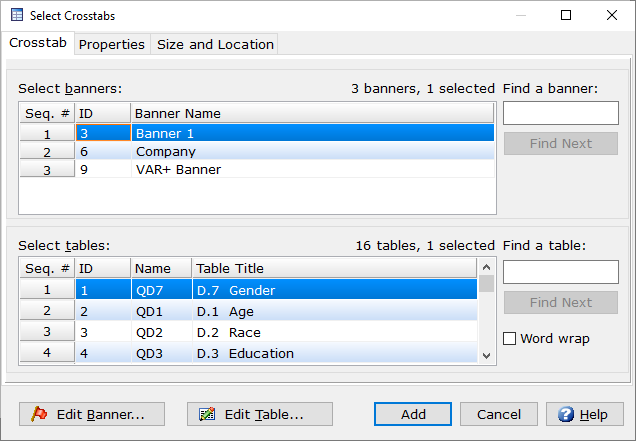
Crosstab
- Select
banners - All banners created in the job file are populated
here. First select a banner and then select desired table(s).
- Select
tables - All tables created in the job file are populated
here. If desired, first select a banner and then table(s). Tables
can also be added without a banner and are run in Total.
 - When selected the Banner Editor window
will appear to easily make changes to a banner without leaving the Presentation
window.
- When selected the Banner Editor window
will appear to easily make changes to a banner without leaving the Presentation
window.
 - When selected Express Tables from
variable data table editor opens to easily make changes to the selected
table without leaving the Presentation window.
- When selected Express Tables from
variable data table editor opens to easily make changes to the selected
table without leaving the Presentation window.
- Add
- Add banner/table(s) to presentation.
- Cancel
- Closes window.
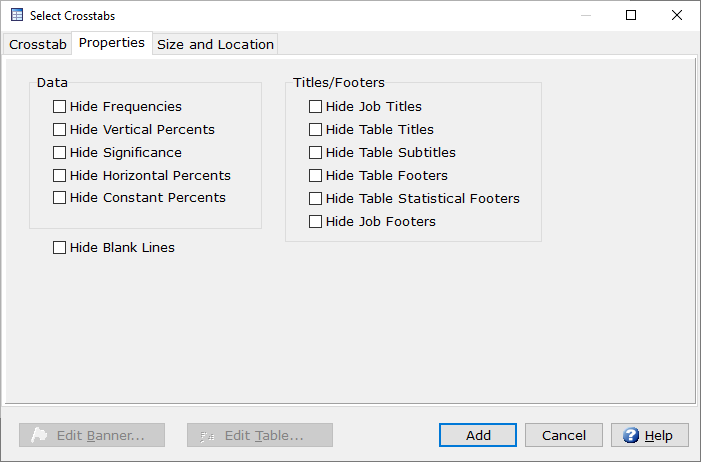
Properties
- Data
- Hide
Frequencies
- Hide
Vertical Percents
- Hide
Significance
- Hide
Horizontal Percents
- Hide
Constant Percents
- Titles/Footers
- Hide
Job Titles
- Hide
Table Titles
- Hide
Table Subtitles
- Hide
Table Footers
- Hide
Table Statistical Footers
- Hide
Job Footers
- Hide
Blank Lines - Hiding uneeded blank lines can be very
helpful to fit more rows on a presentation and eliminate unused space.
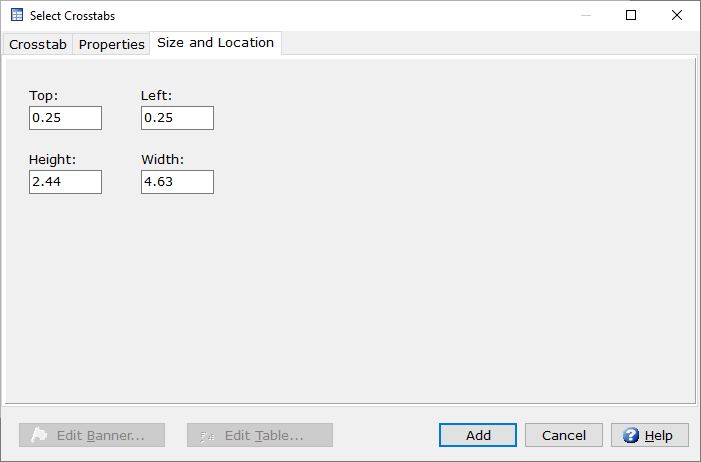
Size
and Location
- Top
- Adjust the top margin of the crosstab.
- Left
- Adjust the left margin og the crosstab.
- Height
- Adjust the height of the crosstab.
- Width
- Adjust the width of the crosstab.
Related topics:
Presentation Label
Presentation Chart
Presentation
New
Presentation
Editor
Presentation
Properties